Data consulting
Deciding with evidence
We turn scattered data — yours and public — into a system that answers where the next dollar goes furthest, through which lever, and with what expected return.
When intuition stops being enough
Any organisation splitting limited resources across several units — branches, regions, programmes, territories — faces the same question: where does the next dollar go furthest. It usually gets answered by inertia, by habit, or by whoever argues hardest. Sometimes that's right. The problem is there's no way to know whether it was.
Having data isn't the same as being able to decide with it. It's normally spread across systems that don't talk, with geographies that don't line up, incompatible formats, and series that changed definition halfway through. Sorting that out is 70% of the work and it's the part nobody wants to do.
What we build is the layer that goes from data to decision: we integrate the sources, calculate the indicators that rank, fit the models that estimate the return on each intervention, and hand over a dashboard your team runs on its own.
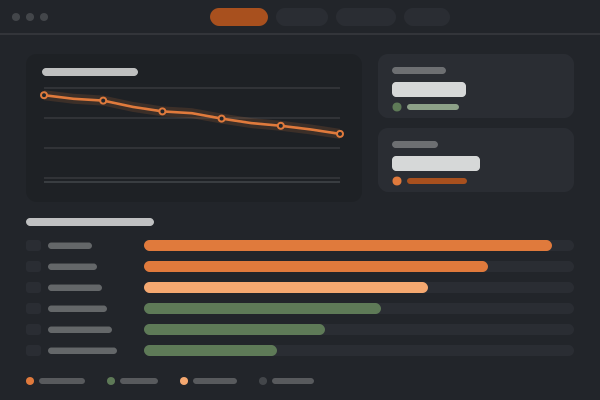
What we do
From scattered data to a dashboard
Six pieces that usually travel together, though a given project may only need some.
Data integration
Usually the problem isn't missing data. It's that the sources don't talk to each other.
- Your own sources unified with public and official data
- Master mapping table between geographies that don't line up
- Continuity audit: what changed definition between periods
- A documented, versioned database — not a loose spreadsheet
Indicators that rank
Getting from the raw table to the handful of numbers that actually support a decision.
- Floor, ceiling and real range for each unit
- Volatility and elasticity: where the needle moves and where it doesn't
- A ranking read in blocks, not by exact position
- Long series, to separate trend from noise
Scenarios and expected return
What happens if you pull this lever and not that one — with the error range on the table.
- Expected-performance models and their residuals
- Scenario simulation over explicit assumptions
- Validation against earlier periods
- Assumptions stay visible and get discussed
Where the next dollar goes furthest
The answer is rarely «the same everywhere» or «all of it to whoever ranks first».
- A split that equalises marginal return across units
- Your real budget constraint as the starting point
- Periodic contrast between the optimal split and the executed one
- Estimated cost of each point of improvement
A dashboard that just opens
A file that runs in any browser. No server, no install, no monthly licence.
- Reports organised by the question they answer
- Every panel states where its data came from
- Works without a permanent connection
- Shared by email or a shared folder
So it stays with your team
A tool only its builder understands is a dependency, not an asset.
- Training for the people who will use it
- A user manual written without jargon
- A documented update protocol
- Database, models, scripts and docs handed over to you
How we work
Five phases, each with a deliverable
Each one closes with something concrete you review and approve before the next begins.
-
Integrated database
The longest phase and the one that determines the quality of everything else. Sources get gathered, geography and format mismatches resolved, and definition changes over time audited. Ends with a documented, versioned database.
-
Diagnosis, indicators and models
With the base in place, the full set of indicators gets calculated and the models fitted. Ends with a diagnostic report and the first prioritised ranking, error margin declared.
-
Dashboard and handover
The dashboard gets built and the team that will run it gets trained. Ends with the tool delivered, the manual written and the update protocol agreed.
-
Support and recalibration
The long phase. The dashboard is updated with new data, assumptions get corrected against what actually happened, and execution is supported with a periodic review of deviations.
-
Close-out and evaluation
Predictions are recorded and dated before the events occur — without that there's no evaluation possible. Ends with a report on what the model got right, what it didn't, and what to fix next cycle.
How we do it
The standards we don't negotiate
This is what separates analysis that survives a hard question from analysis that collapses at the first «where did that number come from?».
Every number says where it came from
A dashboard inevitably mixes official data, derived calculations, assumptions up for debate, and estimates. All four get labelled in the panel itself. That's not pedantry: it determines what you can state publicly and what you can't.
We say how much error it carries
Every model has a margin. If the error is three points, two units separated by less than that aren't distinguishable, and the ranking gets read in blocks rather than by position. A number without its uncertainty is an opinion with decimals.
We work on aggregates, never on people
The analysis is territorial. No individual profiles get built and no personal records get cross-referenced. Beyond what data protection law requires, that's where the value is: what explains a territory's behaviour is its structure, not anyone's file.
We don't confuse places with people
«Areas with profile X perform like Y» is not the same as «people who are X do Y». The second is an ecological fallacy, and it's where the most expensive segmentation mistakes come from.
What gets built stays with you
The database, the models, the scripts and the documentation are yours when we finish, with what you need to run them without us. If next year you'd rather do it in-house, you can.
We also say what it doesn't do
An analytical system describes structure and estimates the return on an intervention. It doesn't predict the future and it doesn't replace the judgement of people on the ground. Being explicit about the limit is part of the tool being used well.
Who does it
The same team, on every project
Three partners with complementary backgrounds, working together on every engagement — software or analysis. There's no sales team that promises and a technical team that delivers: the person who listens is the person who builds.
Tell us which decision is hard
One short call is enough to see whether your data supports this. If it doesn't, we'll tell you and save you the project.
Write to us